Nifty Trend is Emerging, Alignment of Indicators Like Never Before!
Aug 31, 2023
Advanced Elliott wave – Neo Wave along with Time cycles are all getting synchronized together suggesting a major breakdown can happen!
It is not very often we see alignment of indicators that is being witnessed now. Look at the below chart of Nifty with Neo wave counts and Time cycle and a customized AK Trend indicator.
Nifty daily chart: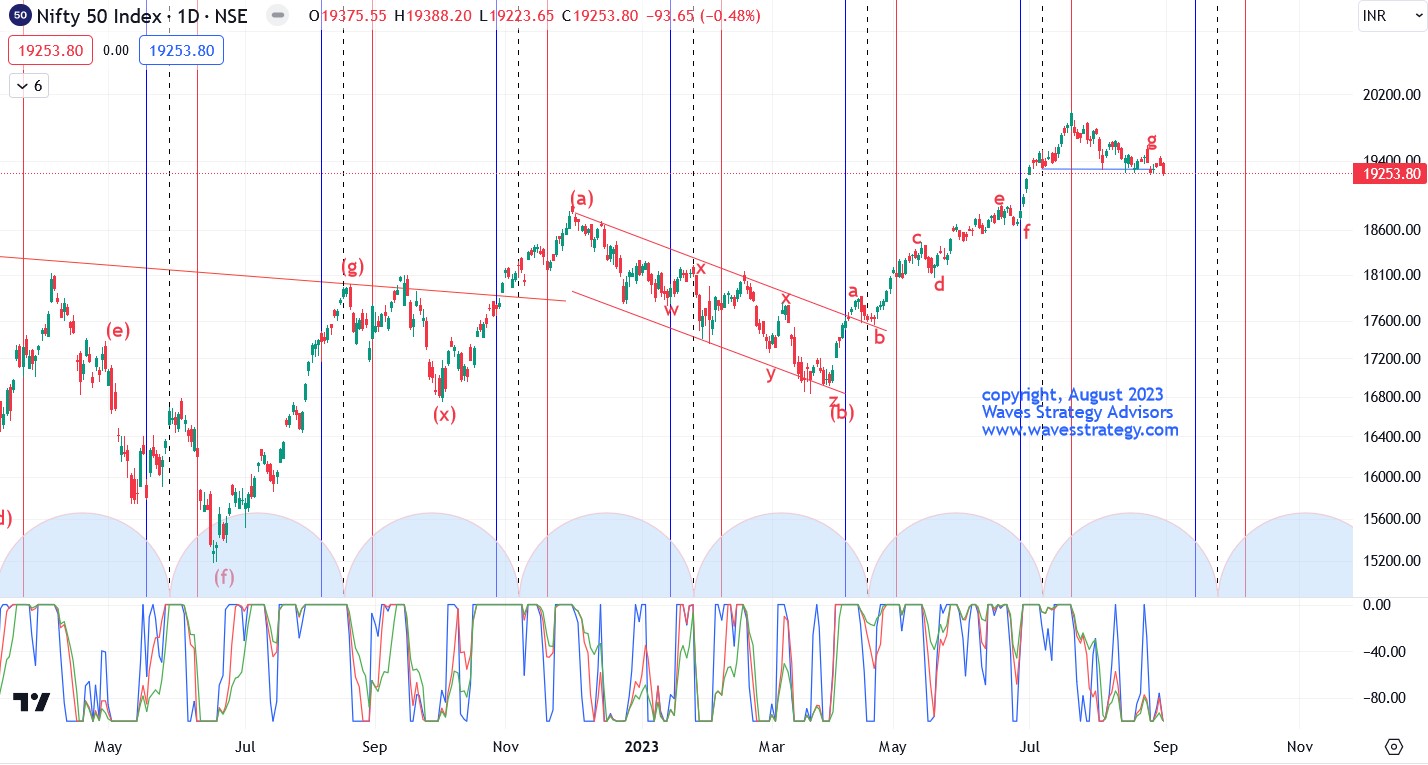 Neo wave analysis – Neo wave has more rules as compared to Elliott wave along with newly identified patterns like Diametric.
What is Diametric pattern – This pattern is 7 legged structure which is labeled as a-b-c-d-e-f-g. In this pattern we see relationship between Price and/or Time as follows – wave g tend to equality with wave a, wave f tends to equality with wave b, wave e tends to equality with wave c.
In above chart we can see that the entire rise started from April 2023 is in form of Diametric pattern. This rise looks to be complete now and close below 19220 will further confirm that retracement of the entire rise or downside correction has started.
Two stage confirmation – This is advanced technique to confirm if major tops or lows are formed. We turned super bullish near 17060 levels when the up move was just starting and now we are getting cautious as there is confirmation of downside reversal.
Time cycle – Nifty is breaking below the low made on 7th July 55 Days Time cycle that confirms that the short term top might have formed until the next cycle low which is due on 25th September 2023. So both Neo wave and Time cycles are in sync for a bigger downtrend to possibly start.
AK trend customized indicator – this indicator shows that during uptrend the green line is at 0 level and other blue and red line deviates whereas during downtrend all three lines converge on downside near -100 levels. This indicator is also aligned on downside here.
In a nutshell, above advanced techniques of Technical Analysis is suggesting that the up move is in danger and we can see correction to 18838 Gann levels or lower near 18600 where previous wave f is placed.
Master of Waves (MOW) – Learn the science of trading using Elliott wave, Neo wave and Hurst’s Time cycles along with Gann analysis in online live program 16th – 17th September 2023. Early Bird Ends on 5th September. Along with it get bonus videos, immediate access to 6 hours Elliott wave videos in addition to the live sessions. Fill below form for more details: