Nifty Volume Profile – POC and Elliott Wave
Dec 22, 2021
Like this Article? Share it with your friends!
Volume profile helps us to see behind the scenes what big players are trying to do. Volume profile with Elliott wave can provide amazing trade setups.
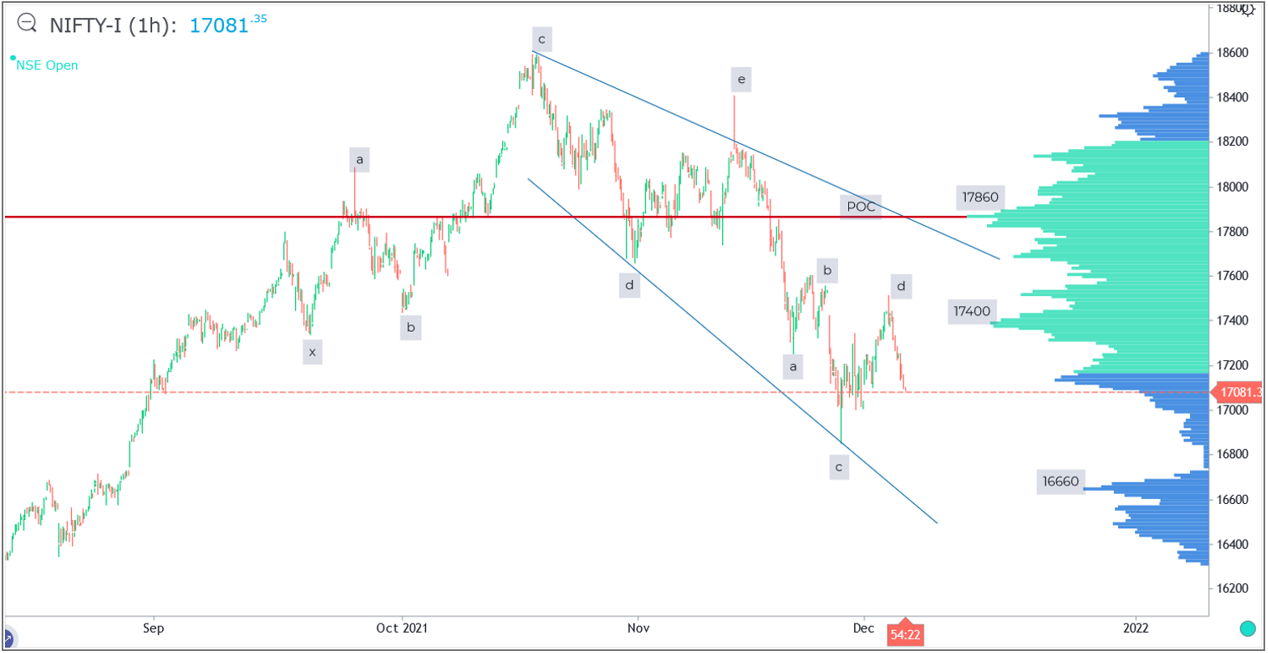
We have shown the below chart of Volume profile on 6th December 2021:
Nifty Hourly chart – shown on 6th December 2021
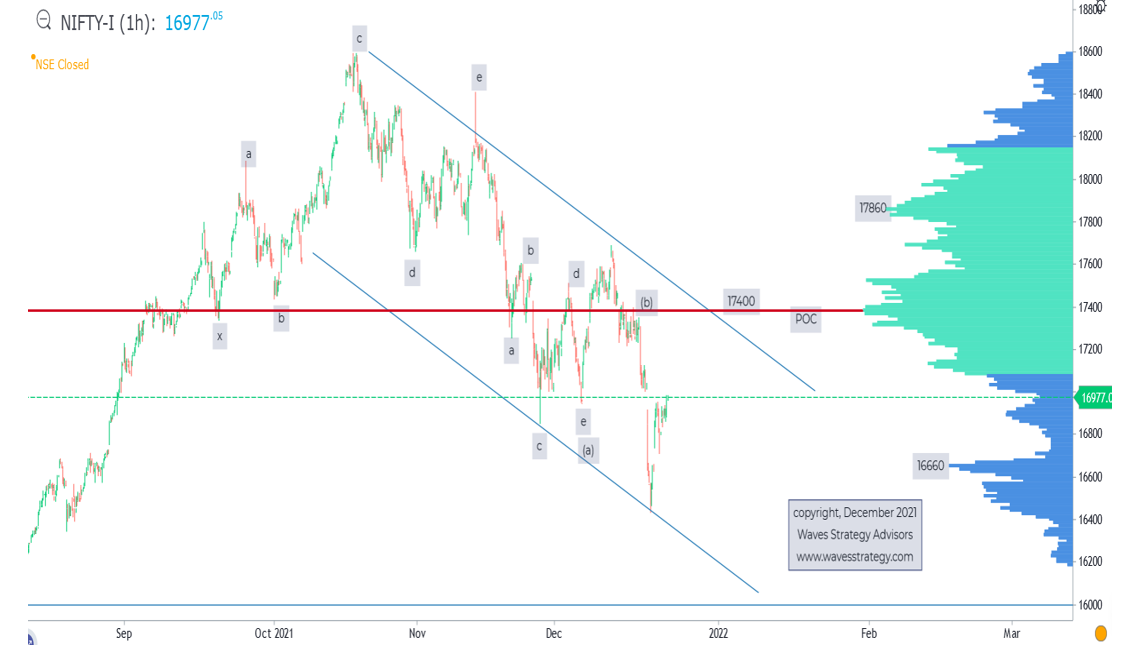
Nifty Hourly chart – Happened
First chart shows the Volume point of control (VPOC) the red line where we can see highest volume occurrence on the price was at 17860. This level is major hurdle for prices to cross given that major activity of distribution happened at that level as on 6th December.
Now look at the second chart, the pullback on upside halted below 17860 and just whipsawed around 17400 which is now the highest volume node. Post that there was a crash on downside and prices moved towards 16660 levels that we show as another important Volume area. From there we are seeing a bounce on upside.
As per Elliott wave – Neo wave we can see that prices possibly completed wave (d) on downside and now wave (e) pullback is witnessed. This should be a temporary rise and prices should fail to cross back above 17400 POC level. This is also coinciding with the upper end of the channel.
Thus by combining simple Volume profile technique along with Neo wave method one can form amazing trade setup even for Intraday by seeing charts on a 15 minutes time frame.
Master of Waves MOW- Learn to trade Options using Elliott wave – Neo wave, Ichimoku Cloud, Time Cycles and much more on 15th – 16th January 2022. Techniques can be applied for Intraday / Positional Option buying and selling, Learn Option multiplier strategy along with Elliott wave and Time cycles – know more here