How the 31-Day Time Cycle Predicted a 15% Rally in Paras Defence
Jun 10, 2026
Sharp market moves often make traders believe the market is rigged or that institutions are hunting their stop-losses. In reality, institutions focus on high-liquidity zones, not individual traders. While identifying these zones can be difficult, Time Cycle concepts can help traders spot potential reversals more effectively.
What is Time cycle?
- Time cycle is an advanced concept unknown to many but few traders. It helps a trader to identify potential reversal zones with high probability.
Look at the below chart of Paras Defence & Space Technology with the time cycle applied on the daily time frame chart that was anticipated on 5th June 2026 in our Vayu report.
PARAS Daily chart: Anticipated as on 5th June 2026
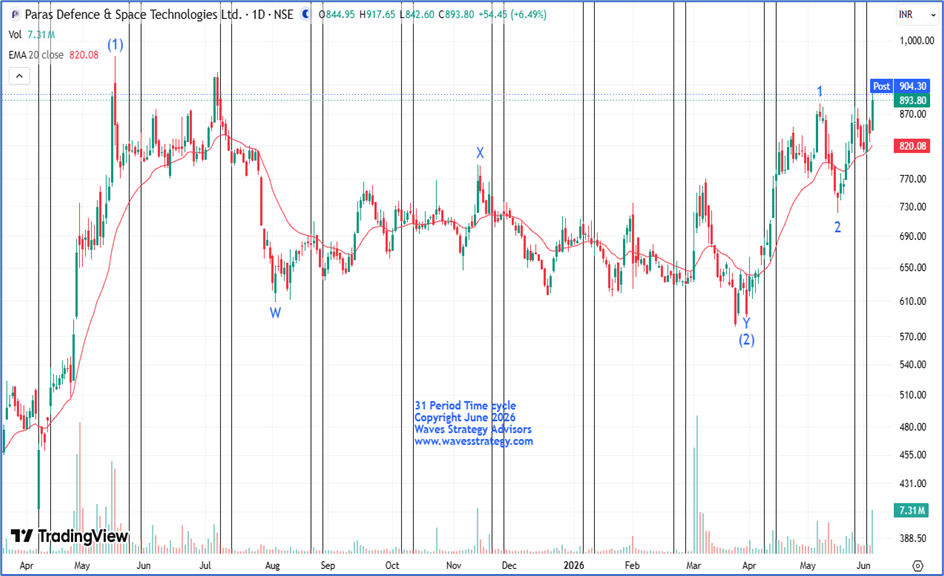
Analysis as on 05th June 2026
On the daily chart, in the previous trading session, stock surged nearly 7% and finally gave strong breakout of the resistance level of 888 and managed to close above it at 893.8 which indicates a bullish strength. Also, on 2nd June 2026 prices tested 20 period EMA and showed sharp bounce on the upside from it, surging nearly 14% from it, reinforcing reliability on 20 period EMA support level and indicates that bulls are taking control of the stock due to which further upside move can be seen in upcoming trading session.
Also, prices are moving in uptrend in the form of Higher High and Higher low formation since past 2 months which is a positive sign and indicate stock is in uptrend.
31 Period Time cycle – The stock is currently following 31-period time cycle. It can be observed that the most recent cycle zone occurred on 2nd June 2026, where the stock formed a low and reversed sharply to the upside. In the previous trading session, the stock broke above the prior swing high near 881. A breakout above this level indicates that the cycle has turned on the buy side.
As per wave perspective, post completing wave (1) on the upside back in May 2025 stock completed its wave (2) in March 2026 in the form of Complex Correction (W-X-Y) and now the up move is in the form of wave (3).
In a nutshell, overall trend for Paras Defence & Space Technologies Ltd. is on the side of bulls. For now, a break above 918 can push the price higher towards 945 followed by 990 with 880 acting as the strong support level.
PARAS Daily chart: Happened as on 10th June 2026
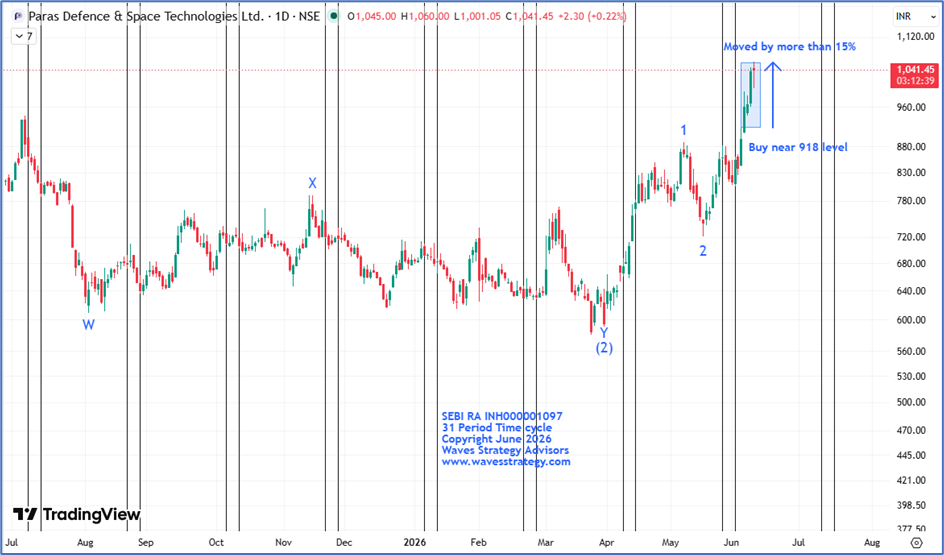
- For PARAS, the 31-period time cycle has worked exceptionally well on the daily timeframe.
- It can be observed, a major low was formed almost exactly around our projected cycle zone near 2nd June 2026.
- Based on the time cycle analysis, we anticipated a positive reversal once the stock crossed above the 918 level.
- The setup played out as expected, with the stock rallying more than 15% in just 4 trading sessions and also made a fresh record high of 1060 level.
- Time trading needs to be combined with price action for precise entry. Combining both can help a trader to derive price targets.
In nutshell, overall trend for PARAS is on the upside. One can use dips as an opportunity to initiate positions as long as 940 remains protected on closing basis.
Our accurate stock market analysis and timely trading insights continue to identify high-potential stocks before major moves. Subscribe to the Vayu Research Report for early stock recommendations and high-probability trading opportunities.
Kalchakra – Bracket Master of Cycles - 4th & 5th July 2026A rare and powerful training where you will learn:
- Time forecasting along with price targets
- Advanced time cycle techniques
- Integration with Gann Square of Nine
- Sacred market science used by few
Brahmastra Mentorship – Advanced Market Timing
Time the market to the very day, hour, and minute using a powerful combination of:
- Elliott Wave & NeoWave
- Hearst Time Cycle Analysis
- Stock Selection Algorithm
- Practical Risk & Money Management
Brahmastra – 3-Month Mentorship Program
- Learn structured market timing techniques
Fill the form below to know more