
PNB Housing How OI & Volume Profile Signal Key Market Moves?
Aug 12, 2026
Traders often prefer Options because of their high risk-reward potential and lower capital requirement, which can provide significant returns with a relatively smaller investment.
Depending on their capital and risk-reward preference, traders can choose to be either Option buyers or sellers and trade accordingly. Among the various tools available, the Option Chain and Open Interest data are two of the most widely used and popular tools among traders.
Option chain analysis
Benefits – IV of options, Options Greeks of each strike, Liquidity, Market Sentiment.
Let us understand it on PNB Housing Finance.
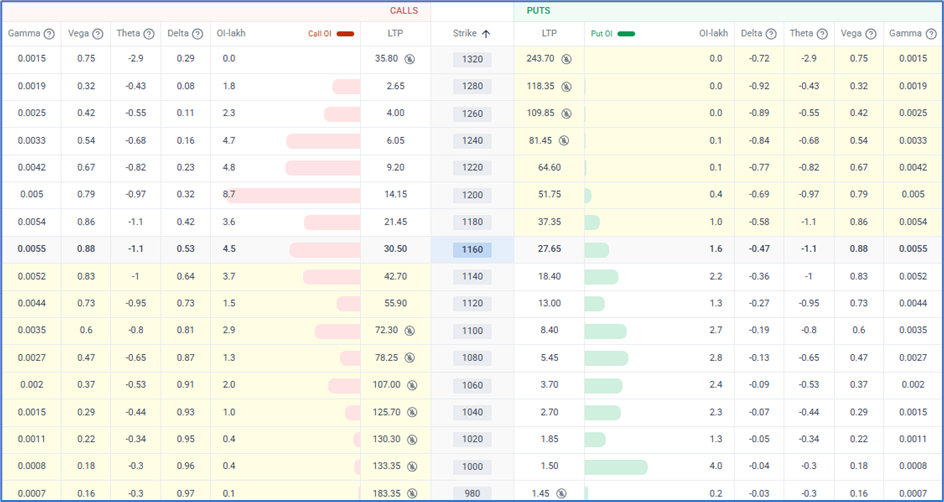
PNBHOUSING Option Chain
Open Interest
- Open Interest (OI) represents the total number of outstanding contracts for a specific instrument at any given time.
- It can be used for both positional and intraday analysis.
- Open Interest is always viewed from the seller’s perspective.
- It helps identify and understand the activity of big players in the market.
Analysis on PNBHOUSING
- Highest OI in CE – 1200
- Highest OI in PE – 1000
What does this mean?
- There is high OI on the above strikes, which in simple terms translates to Resistance and Support levels
- If PNBHOUSING breaks above 1200, Call writers (CE sellers) may be forced to cover their positions, leading to further upside.
- Similarly, a break below 1000 could trigger Put writers (PE sellers) to exit, pushing prices lower.
Volume profile and OI analysis
PNBHOUSING Daily chart
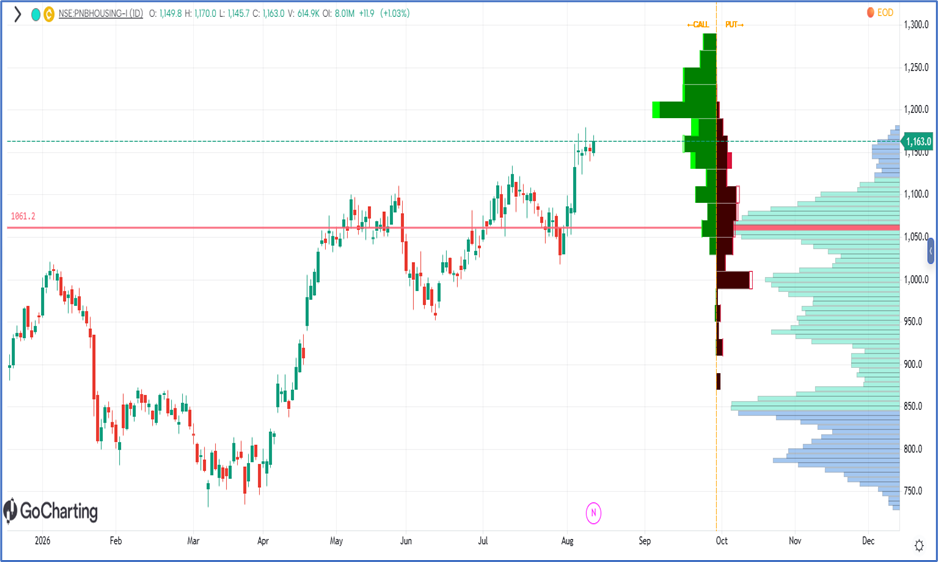
As shown on above chart, the left side shows green buildup and is suggesting change in Call open interest and right-side shows Put open interest. PNBHOUSING is trading near 1160 after a strong recovery. OI data shows strong support around 1060 (POC level), keeping the bias positive above this level.
In a nutshell
- Option Trading can be made easier by using these simple methods of analysis, one can clearly form option strategy in direction of big players by looking at Open interest profile. It is also crucial to know strike price selection to make the most of the move.
- For now, a move above 1200 can push prices toward 1250 followed by 1300, while a break below 1130 may weaken the structure and open room for downside.
Brahmastra (Mentorship on Timing the market)
Learn to time the market to the very Day, Hour and Minute by combining the concepts of Hurst’s Time cycle on Index and stocks as well, Gann square of 9, Elliott wave, Neo wave and be a part of elite trader’s community who are Time Traders.
Fill the form now
3 Months of TRISHUL Membership (Options Mantra + Elliott Wave + Neo Wave)
Trishul Membership – Options Trading with Elliott wave, Neo wave, Ichimoku cloud, and sacred science of trading & forecasting is covered in the Options Mantra Live Sessions - 12th - 13th September & Sutra of Waves Live Session - 10th - 11th October 2026. Limited seats available.