Why both main Precious Metals are Rallying so much?
Aug 05, 2020One of the biggest opportunities lately has been in gold. Now see how, at several important moments in gold’s month-long rally, our daily and intraday analysis made a difference to subscribers.
Gold’s much-less-expensive cousin, silver, has also had a good month. In fact, over just a few trading days from July 20, silver prices soared 33% till now.
Now see the near-term Elliott wave pattern and indicators such as MACD, RSI, Ichimoku cloud that proves the big move.
Below is the daily chart of MCX Gold and MCX Silver justifying the up move.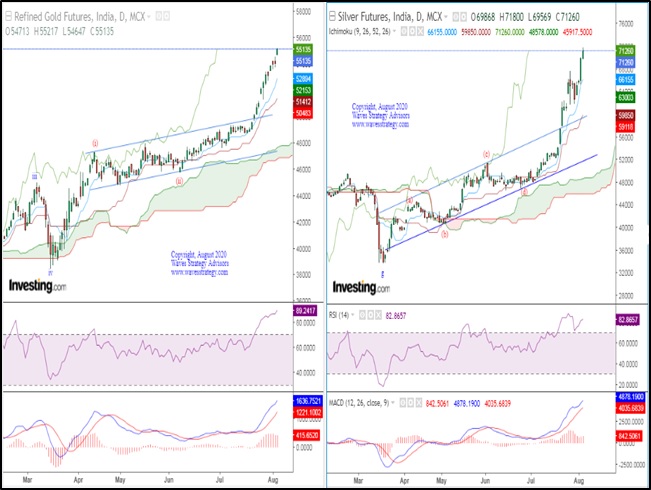
There are 3 things which helped us to support the strong rally. Otherwise it’s not easy to believe and enter on such overvalued metals and there’s always a fear of downside retracement post a huge rally.
Analysis done by using 3 indicators which showed the similar outcomes on both metals in addition with the wave theory confirmation.
As you can see Ichimoku cloud assisting in up move for both the metals prices has been shooting upside post the cloud break out. Also Base and conversion lines placed below the prices indicating positive bias.
Talking about the MACD which is also known as momentum indicator which helps during such rallies. The MACD indicator is a momentum indicator based on the difference of the 12 and 26 EMA. In both the cases, the MACD line crossing above the signal line indicates rising momentum. We can see on the daily chart MACD is has cross the signal line on the upside and both are already above the zero line which indicates positive momentum.
RSI there’s always question raise when and which RSI levels could be considered as oversold or overbought levels. By seeing the above charts one would find risky to trade with such a spiked up RSI. However we were not worried with the numbers and RSI levels. As Elliott wave patterns also suggested the upward movement to continue. In MCX Gold we are seeing wave (iii) red of wave v blue is on-going which is anyway powerful. Similar in MCX silver we are in wave (e) red unfolding on upside.
The above research proves that combining wave theory with different indicators such as Ichimoku cloud, RSI, MACD etc. It helped in identifying the trend in Gold and silver which is positive.
To know more in detail where will these metal further head till what extent, where will it stop get the copy of daily commodity Research Report which has in-depth studies, accurate levels described. Subscribe now and do not miss the amazing opportunity to ride the up move. Subscribe for the copy here
You can subscribe to the Intraday / Positional calls on commodity via SMS, WhatsApp and get detailed research along with it explaining the clear technical picture. Subscribe Here
Get strategies which could be applied across all segments in the upcoming ONLINE training scheduled on learn about Neo wave, Elliott wave, Time cycles scheduled on 22nd and 23rd August Master of Waves (MOW). Dedicated discussion groups will be created to keep the learning going in future. Register now only limited seats left Know more here