TANLA Path Predicted with price action and simple indicators.
May 19, 2025
When combining basic price patterns with technical indicators like Bollinger Bands, one can effectively capture significant movements in stocks. See how we captured a significant move of more than 9% in Tanla Platform Ltd stock.
We published the following research on Tanla Platforms Ltd on 14th May 2025 in the “Vayu Momentum Report” which our subscribers receive pre-market every day.
TANLA Daily chart Anticipated as on 14th May 2025
 Wave Analysis as on 14th May 2025:
In the previous session, Tanla Platforms Ltd gained more than 12%. On the daily chart, the stock had been trading into well-defined consolidated zone of 409-529 levels since early March 2025 but in previous session stock finally managed to give a breakout of the said range and closed at 557 levels backed by a sharp rise in volumes confirming the strength of the breakout. Along with this, Bollinger bands® have just started to expand which is also a positive sign. However, post sharp rise, buying on dips appears to be a smart approach to ride the trend for the better risk management.
In a nutshell, trend for TANLA has shifted to the positive side. Use dips as a buying opportunity for a move towards 600 levels as long as 530 holds on the downside.
Key Resistance: 600
Key Support: 530
Trading Strategy: Use dips towards 540-545 as a buying opportunity with the targets of 570 followed by 600 with the stoploss of 530 levels.
Tanla Daily chart Happened as on 19th May 2025
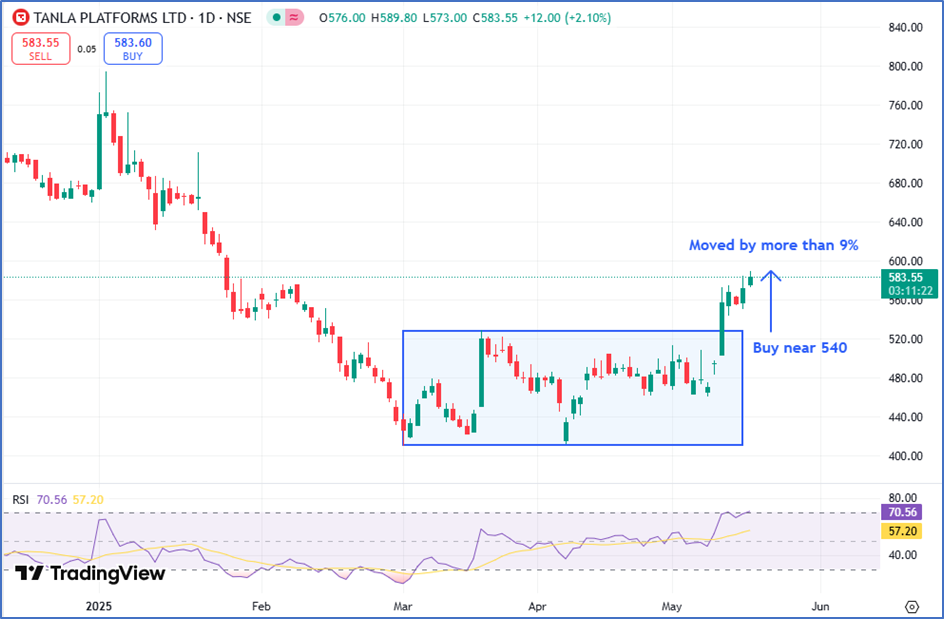 Happened: After we published the report, the stock moved in sync with our expectations. Tanla Platforms ltd showed a rise of more than 9% and BANG ON!! Prices managed to achieve our target 1 and made a high of 589 levels which is near our target 2. We successfully captured this entire rise by price action and simple indicators.
It is fascinating to see how accurately combining basic indicators like Bollinger bands along with price action can help to predict price targets with accuracy.
Trishul Membership – Options Trading with Elliott wave, Neo wave, Ichimoku cloud, and sacred science of trading & forecasting is covered in the Trishul membership program scheduled on 7th - 8th June & 12th - 13th July, Fill out the form below for more details