Tube Investment following 63 Days’ Time Cycle and Bollinger Bands®
Feb 07, 2022
Like this Article? Share it with your friends!
One of the most important aspects of a trader is to time the market. To do this there is no better tool than time cycles which be used with other techniques that can add to improve the accuracy of trade setups.
We have shown below chart how the Time cycle can be used in Tube investments to identify a good trade setup.
Time cycles are simple way to identify when the next low is going to be forming and accordingly using Candlesticks and technical indicators once we know the buying area.
Many of the breakouts fail because many traders do not time their entry, if the time is in sell the breakouts will not sustain.
Tube Investments Daily chart with 63 day Time Cycle:
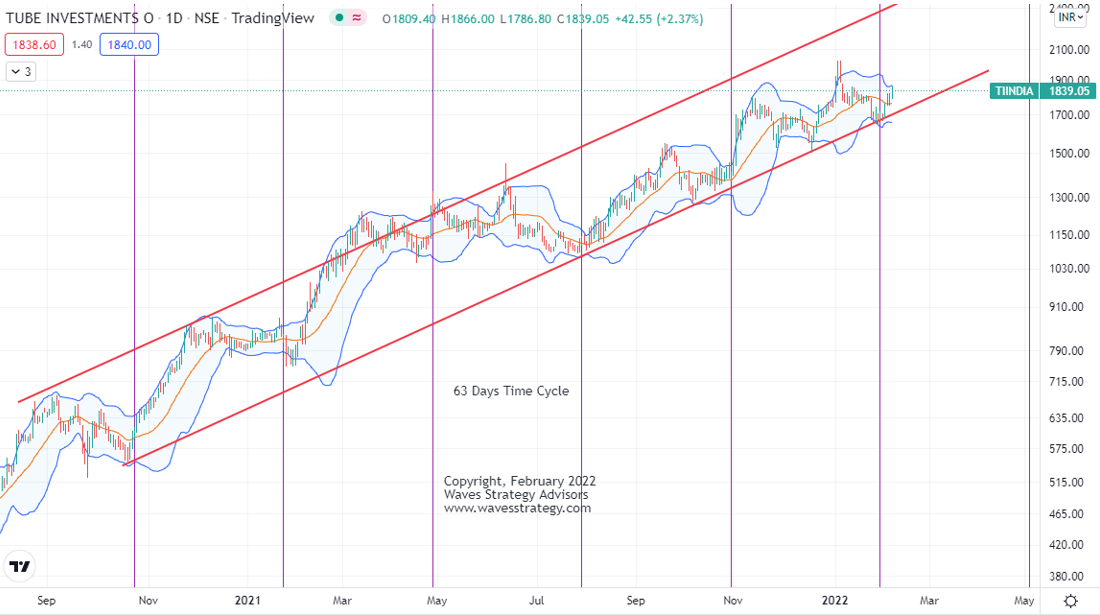
On the daily chart of Tube investments, the vertical lines represent the 63 day time cycle which we have identified on this time frame. Notice how after every 63 days near the vertical line an important low is formed with a slight variation of one of two bars.
We can see that near the most recent time cycle, prices formed a swing low close to the channel support and the lower Bollinger band. This confirms that a low has been formed and prices can moved higher over the next few days towards the upper end of the channel.
Fresh long position can be created once price closes above the upper Bollinger Band and a stop loss can be placed below the swing low formation and one can ride the trend on the upside as long as the price does not close below the mid Bollinger band.
This is a simple way by which one can combine Time Cycles along with Bollinger bands for a powerful trade setup.
Huge conviction to take a trade comes only by understanding that the time is favourable. If time supports a simple method of Bollinger Bands breakout and Channels can be used to trade. This is the power of Time.
Similar to this we have identified Time cycles on Nifty, Bank Nifty, Crude, Bitcoin and many other stocks right from 5 minutes for Intraday trading to weekly for Investments. We will be giving away this science of Time to the participants of Master of Cycles – MOC which is happening on 19th – 20th February 2022. This will change the way you ever trade and increase your accuracy with consistency which might be lacking so far. So, do not miss out this amazing opportunity of Timing the market – know more here