Nifty Crash with Crude Oil on a Boil: Will Rising Oil Derail Indian Equity Markets?
Mar 09, 2026
Crude oil has surged above $100 amid global tensions. Does rising oil threaten Nifty? Explore the Nifty–crude ratio, Elliott Wave analysis, and long-term correlation between crude oil and equity markets.
Nifty weekly analysis with Crude Oil
Nifty-crash-crude-oil-correlation-analysis
The recent surge in crude oil prices above the $100 mark has triggered concerns across global financial markets. For an oil-import dependent economy like India, rising crude prices are often viewed as a negative development because they can widen the fiscal deficit, pressure the rupee, and raise inflation risks.
As a result, the Indian equity market has reacted with volatility, leading to concerns that a sustained rally in crude oil could derail the ongoing equity cycle.
However, a deeper analysis of price ratios, Elliott Wave structure, and historical correlation between crude oil and the Nifty index suggests a more nuanced picture.
Nifty–Crude Oil Ratio: Elliott Wave Structure Signals Key Inflection
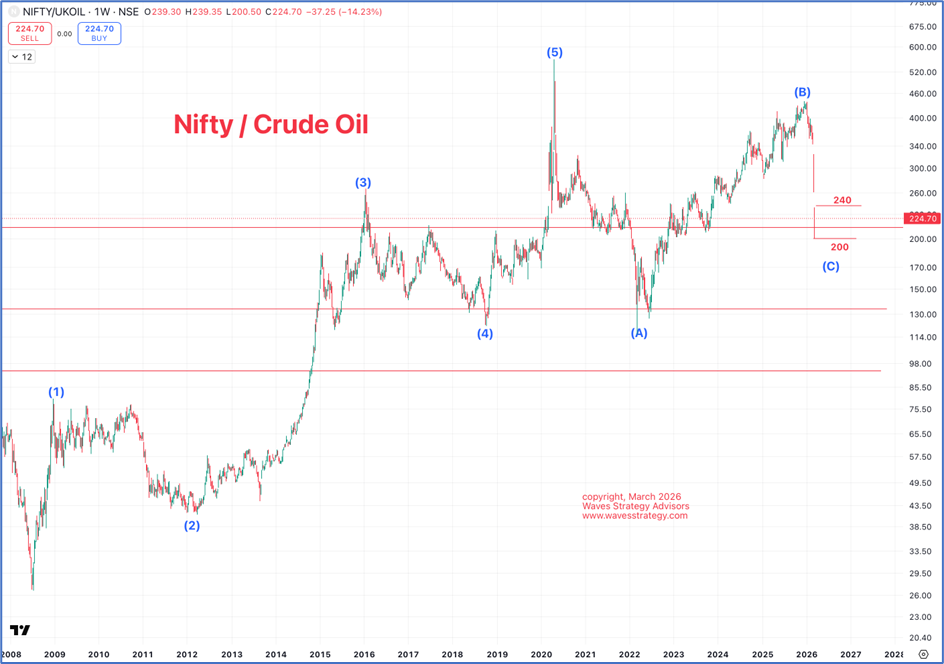
The first chart examines the ratio of Nifty divided by Brent crude oil, which provides a clearer view of how equities are performing relative to energy prices.
From a structural standpoint, the ratio chart shows that the market completed a five-wave impulse on the upside, consistent with the Elliott Wave framework. Following this impulse move, the ratio has been undergoing a flat corrective pattern, with Wave C currently in progress.
At present, the Nifty-to-Brent crude ratio is trading near 224.
This level represents an important technical zone.
- A move above 240 in the ratio will be critical for stability.
- Such a move would indicate either:
- crude oil prices are topping out, or
- the Nifty index is beginning to regain upside momentum.
Therefore, the ratio chart suggests that the market is currently approaching a key inflection point.
The Surprising Historical Relationship Between Crude Oil and Nifty
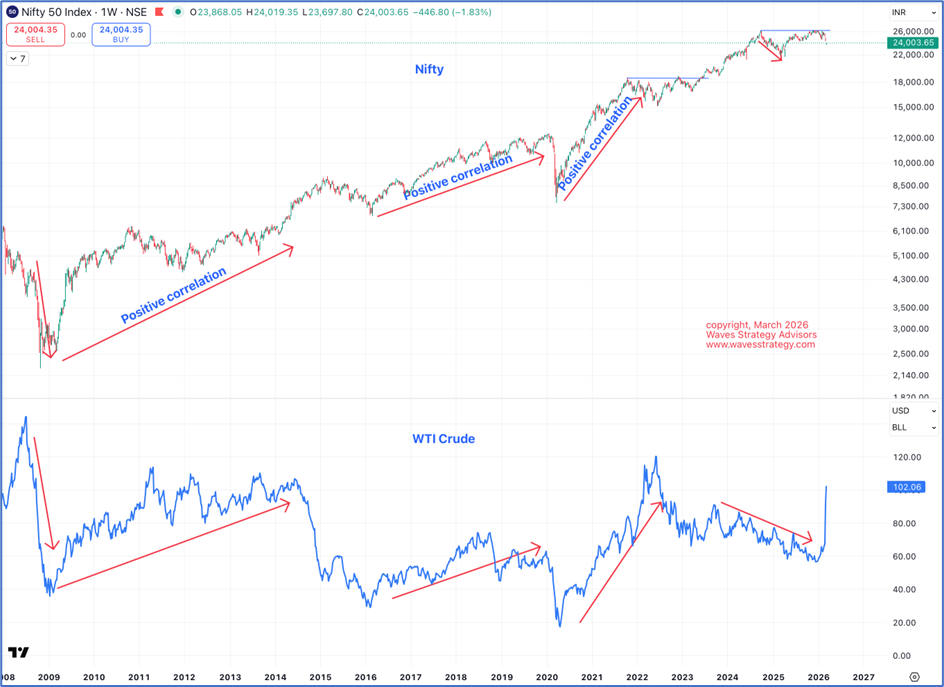
The second chart provides an even more interesting perspective.
It plots Nifty and crude oil together on a weekly timeframe, with crude oil shown in the lower panel and Nifty in the upper panel.
Contrary to common perception, the data since 2008 shows that crude oil and Nifty share more positive correlation than negative correlation.
Several historical phases demonstrate this relationship clearly.
2008–2014: Strong Positive Trend
During this period, both crude oil and equity markets moved higher together, reflecting a global growth cycle where rising demand pushed both commodities and equities upward.
2016–2020: Correlation Continues
From 2016 to early 2020, both markets again moved broadly in sync. Even the sharp fall in 2020 during the global market crash occurred simultaneously in both crude oil and equities.
2020–2022: Post-Pandemic Recovery
Following the 2020 crash, the recovery phase saw crude oil and equity markets rally strongly together until mid-2022, reinforcing the positive correlation.
The historical evidence therefore suggests that boiling crude oil is not always bearish for equities.
Why Rising Crude Is Currently Pressuring Markets
In the current environment, the rise in crude oil prices is primarily driven by supply constraints caused by geopolitical conflict and war-related disruptions.
This is fundamentally different from demand-driven oil rallies.
When crude rises due to strong global demand, it often signals economic expansion, which is supportive for equity markets.
However, when prices surge due to supply shocks, markets tend to react negatively in the short term because of inflation concerns and uncertainty.
This is exactly the dynamic we are witnessing today.
What Happens When the War Ends?
Geopolitical conflicts historically tend to produce temporary distortions in commodity markets.
Once tensions begin to ease, supply normalizes and crude oil often retraces sharply lower.
Such a move can produce a positive shock for equity markets, as inflation fears reduce and risk appetite returns.
Therefore, the current pressure on equity markets may represent a short-term adjustment rather than a structural shift.
Key Technical Levels to Watch in Crude Oil
One critical level to monitor is $122 in WTI crude oil.
This level represents the peak seen during February 2022 when the Russia-Ukraine invasion began.
If crude oil breaks convincingly above $122, it would signal a structural breakout and could intensify inflationary pressures globally.
However, if crude fails to sustain above this level and begins retracing, equity markets could stabilize relatively quickly.
The Bigger Picture: Crude Oil and Equity Markets Move Together
In summary, historical evidence shows that crude oil and equity markets have exhibited more positive correlation than negative correlation over the past two decades.
While rising crude oil prices can create short-term concerns for markets, especially when driven by geopolitical disruptions, the longer-term relationship suggests that equities eventually adjust and catch up.
The Nifty–crude ratio currently indicates that markets are approaching an important decision point.
- A move above 240 in the ratio would signal stabilization in equities and possible topping out in crude oil.
- A breakout above $122 in crude oil would represent a stronger inflationary risk.
For now, the broader view remains that crude oil may first experience a corrective decline before eventually resuming a gradual long-term rise.
3 months of Mentorship (Brahmastra) on Timing the Market – Apply Time cycles with Elliott wave, Neo wave, stock selection, risk management strategy, exclusive mentorship sessions & trade like a pro. Limited seats, Fill below form for more details