Nifty Crashed, What is Next as Per Elliott Wave?
Dec 20, 2021
Like this Article? Share it with your friends!
Nifty has been acting precisely in line as per Elliott wave - Neo wave patterns.
Majority are wondering why Nifty crashed but not paying attention to Time on charts. Nifty broke the low of 55 Days’ Time at 16900 which we highlighted in last week webinar as well. Diametric pattern working out brilliantly as per Elliott wave as well.
We published the following research on 14th December 2021 stating why it is time to sell, See it here again
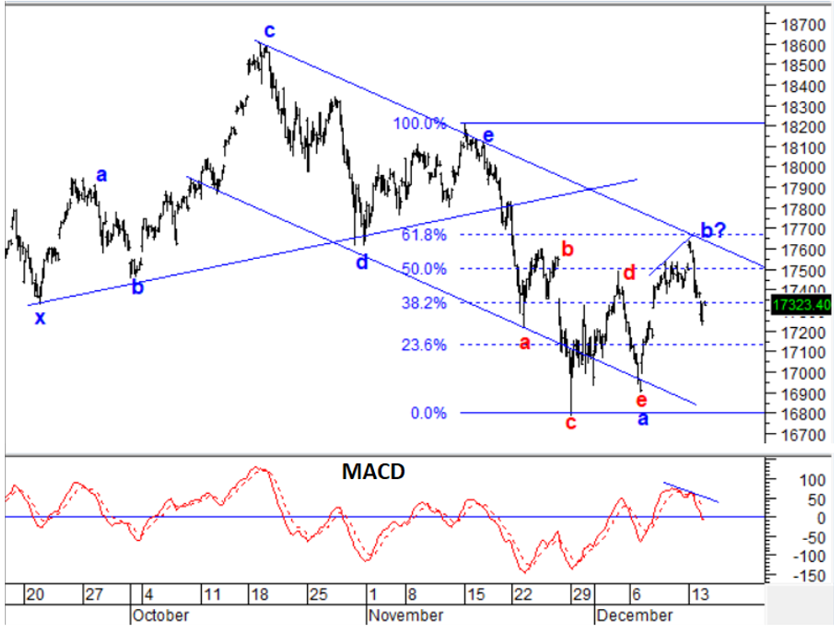
Nifty Hourly Chart as of 14th December (anticipated) :
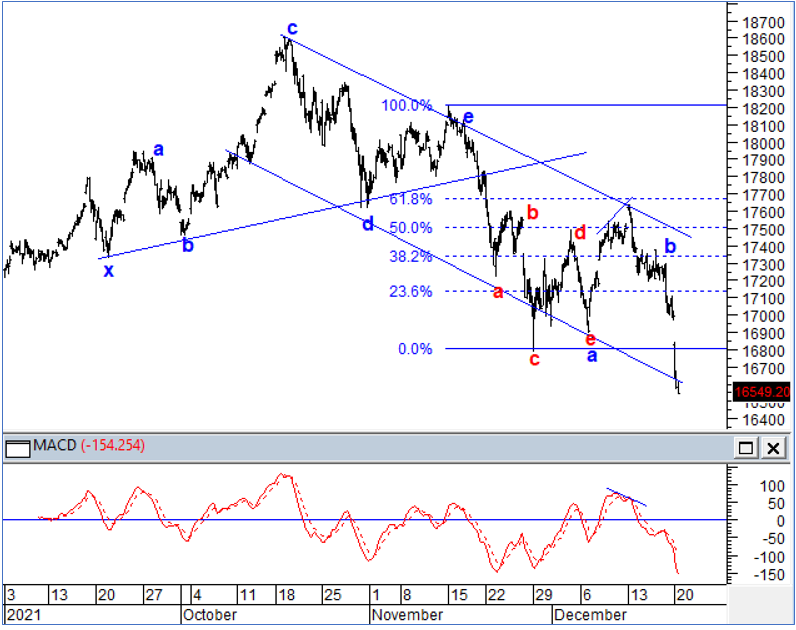
Nifty hourly chart as of 20th December (Happened) :
Elliott wave analysis – Following was mentioned on 14th December
“Nifty post completion of wave e at the highs near 18200 levels Nifty moved sharply lower in the form of wave a (blue). This wave a formed an Extracting Triangle pattern and post its completion near 16895 there is a rise in the form of wave b. This wave b is either complete at the highs of 17600 or is still ongoing.
MACD Indicator – This clearly suggests negative divergence on minor degree from the highs and post that prices show a sharp reversal down. Now the MACD line is about to move below 0 thereby further indicating the overall trend can be sell on rise.
Fibonacci retracement – Nifty reversed from 61.8% Fibonacci retracement level of the entire fall. This hints towards the fact that the rise is corrective and medium-term trend remains negative. This outlook will remain valid as long as Fibonacci level near 17650 remains protected.” BANG ON!
After we published the article on 14th December, Nifty precisely followed the Neo wave pattern we mentioned and has made a low near 16410 levels today.
Happened:
Nifty moved down precisely as expected and moved even below the lower end of the channel today near 16410, Today's sharp fall has turned the 55 days cycle on the sell side but as indicators are oversold pullbacks should be used as selling opportunity. As long as 17200 - 17300 is intact on upside the overall tone will be sell on rise which we maintained since few weeks and it has paid out exceptionally well. Today's low near 16410 is now minor support and pullback is only relieving oversold state.
This clearly shows that by combining Price and Time tools one can form amazing trade setups and same can be seen in the research published on 14th December 2021.
Also, on 17th December 2021 we sent the following call to our positional Nifty call subscribers at 2:40 pm POSITIONAL NIFTY FUT SELL BELOW 17015 SL 17155 TGT 16800
The position was initiated around 3:15 on the same day and today morning Nifty futures directly opened near our mentioned target of 16800. In-fact it made a low near 16431 in futures. This is how effectively one can use wave theory to find good trade setups.
We are in a classic trending market again with ample of opportunities, Time is now to trade well. You can get access to the Equity calls with research report or learn the Elliott wave / Neo wave theory with Time cycles in upcoming Master of Waves (MOW) Season 3, Do not miss out on next big opportunity which is not very often
Subscribe to Equity calls and get free daily equity research report “The Financial Waves Short Term Update” that provide clear strategy using Elliott Wave and indicators on Nifty, Bank Nifty and stocks. Get access over here
Master of Waves – Learn complete Elliott wave, Neo wave along with Time Cycles and equip with excellent trade setups for trading Intraday and positional along with forecasting the markets from very hour, day and months. 2 Days of Live event on 15th – 16th January 2022, Early Bird ends on 25th December, Know more here