Nifty Outlook: Key Gann Levels Signal Range-Bound Trading and High Volatility
Feb 02, 2026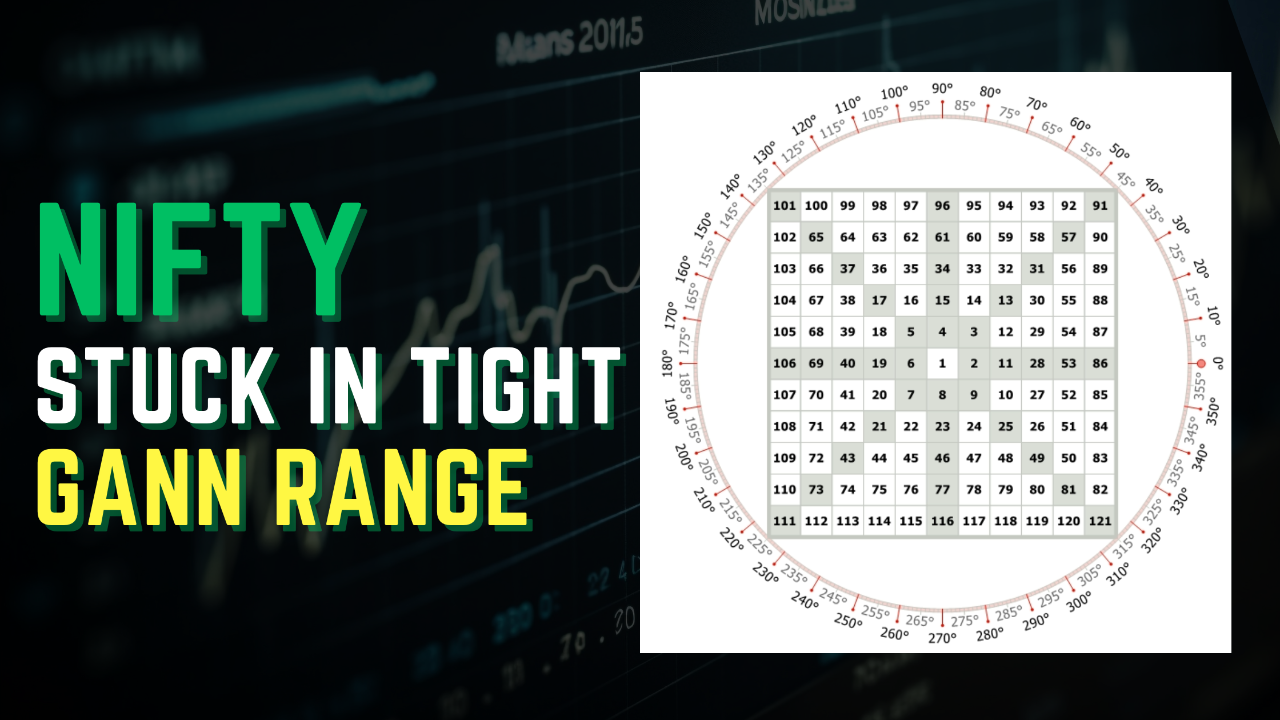
Nifty post the budgetary movement that happened on Sunday continued its volatile activity in both directions. Prices, as seen from the Gann chart, have been moving between 25,361 and 24,728, with both these levels acting as a Gann magnet, clearly resulting in oscillations within this range.
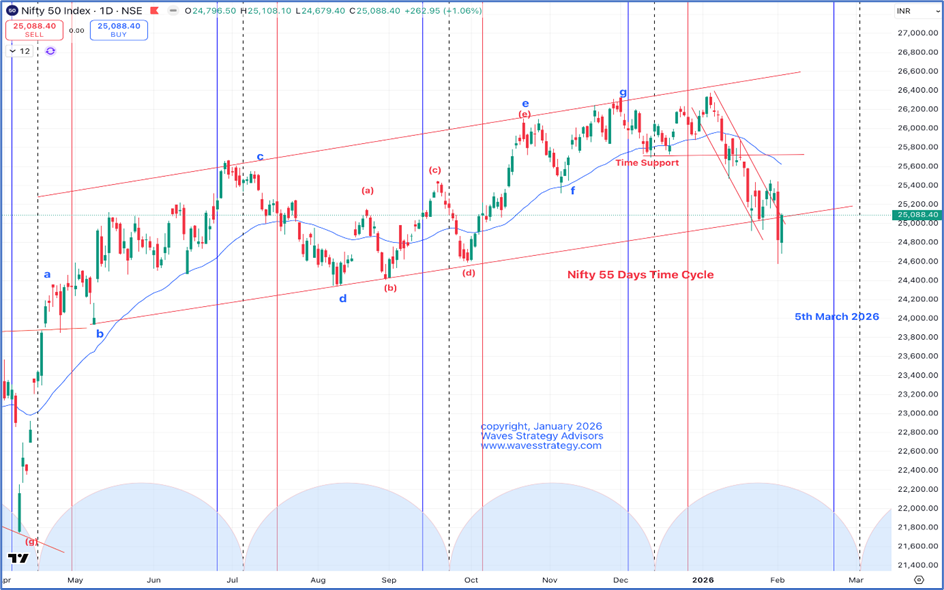
Nifty Daily chart with Time cycle
Nifty Daily chart with Gann Square of 9
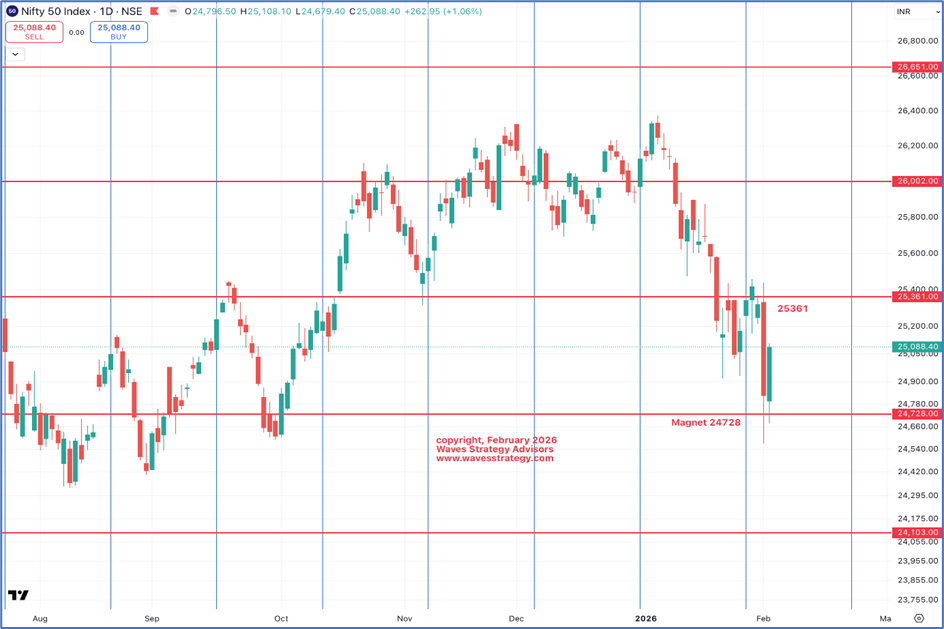
In the prior report, we highlighted that any pullback towards the 24,940 to 24,960 zone could be used as a shorting opportunity for a move back towards the Gann level of 24,728, and this view played out well as prices revisited 24,728 after a brief pullback.
Subsequently, buying emerged from the lower levels, and if Nifty manages to close above the 25,000 psychological mark, it suggests that prices are being attracted on either side by this Gann magnet and are currently trying to establish direction.
FIIs were absent on Sunday and are now back in the trading game, indicating that the market is attempting to discover fair value post the budgetary declaration. In such a scenario, it is prudent to rely on Bollinger Bands as a guiding method.
Key Gann Levels Signal
As per the hourly Bollinger Bands setup, the mid-band near 25,110 becomes an important reference point, and a decisive break above this level can result in a short-term pullback towards the 25,361 Gann level.
However, given the prevailing uncertainty, deploying a short strangle option strategy is advisable, as it tends to work well in markets that are still directionless and volatile.
Over the next few days, we expect the broader trading range to be between 24,680 on the downside and 25,450 on the upside, while the narrower and more active range continues to remain 25,361–24,728.
From a wave perspective, the entire fall appears to have unfolded as a double corrective pattern, with wave c completed on the downside, and a possible triangle formation may now be underway.
The next few sessions of price action will help confirm whether this triangular pattern is indeed developing, and traders should remain cautious unless there is a decisive break of the mentioned ranges.
Summary
In a nutshell, the short strangle strategy should continue to work well due to elevated IVs, and while the market is likely to attempt to find direction over the next two days, we continue to remain in a sell-on-rise mode unless there is a close above the prior day’s high.
However, since Nifty has re-entered the trendline channel, caution is advised at this stage, and we will update if there is any change in the scenario.
Kalchakra – Bracket Master of Cycles
📅 7th & 8th February
A rare and powerful training where you will learn:
- Time forecasting along with price targets
- Advanced time cycle techniques
- Integration with Gann Square of Nine
- Sacred market science used by few
⚠️ Seats are limited
⏳ Early-bird offer ending very soon
👉 For more details, click here.
Mentorship & Training Programs
Brahmastra Mentorship: Timing the Markets
A limited-seat mentorship program focused on:
- Basics to advanced technical analysis
- Elliott Wave & Neo Wave
- Time cycles
- Stock selection algorithms
- Complete understanding of chart patterns
- Exclusive mentorship sessions
- Simple, practical trade setups that actually work
Fill below form for more details